
How to Take Facial Proportion Measurements From a Photo
Take facial proportion measurements from a photo: learn the landmarks for thirds, fifths and FWHR, and understand what can change your results.
Table of Contents
There are several different facial proportion questions, and vertical thirds (hairline → brows → nose base → chin), horizontal fifths (five equal transverse divisions) and the upper-face width-to-height comparisons answer them. They’re all distinct from whole-face length-to-width ratios, which can be used to classify face shapes.
The conventional thirds use these landmarks: hairline, eyebrows, the base of the nose, then chin. The fifths use a different convention that assumes the inner-eye gap is equal to the nasal width, which in turn equals the width of each eye. These assumptions are not necessarily true, but they do make for an easy way to split your face into five equal parts. A popular alternative uses the bizygomatic cheekbone width divided by the height from middle-of-brows to upper lip.
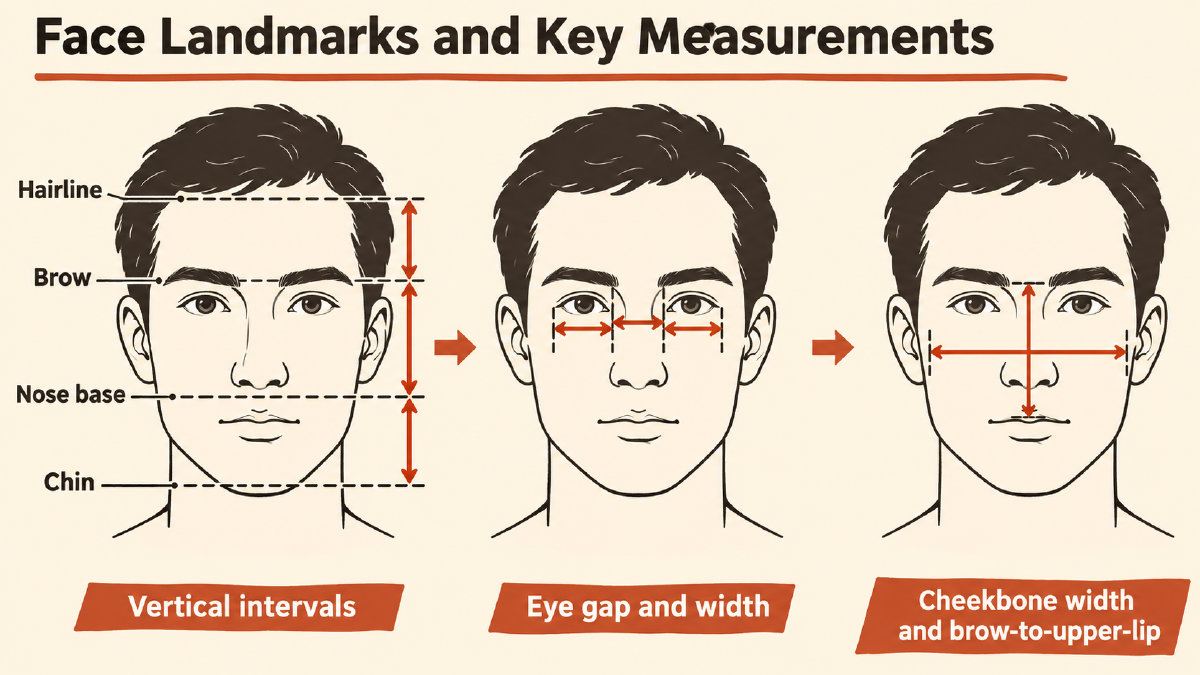
To determine the attractiveness of the face, you can use AttractivenessTest.com’s Face Width-to-Height Ratio calculator. It takes the ratio of the widest point on your face to the distance from the middle of your brows to the upper lip. In addition, facial shape depends on additional relationships between the forehead, jaw and chin.
Photo Setup for Facial Proportion Measurements
Even though this article has a specific research focus, it also provides a repeatable photo setup. Our site has documented the browser workflow, but we’re separating its practical distance advice from the research specifically modeling apparent nasal size. You can follow our documented workflow if you’d like to try your hand at measuring your face using photos — even though we don’t independently test whether this method works across every facial ratio.
Lighting, lens distance, head angle and expression can shift the measurements, although they should remain relatively stable. We’ve tried to describe a consistent method, however.
The following image shows how we would capture a photo for facial proportion measurements.
In short, here’s what you’ll need:
Even frontal light
Front-facing photo
Full face visible
Camera at eye level
Head level
Gaze into lens
Neutral expression
Closed lips
Glasses removed
We recommend shooting from arm’s length or a little farther away. Crop if necessary. Ratios should be independent of overall face size in the frame. Take two or three photos under similar conditions. Lighting, lens distance, head angle and expression may all affect measurements somewhat. However, we have tested our documented workflow rather than trying to validate every possible facial ratio. For now, we’ll rely upon the mathematical model developed by Ward and colleagues, who modeled the effect of camera-distance on perceived nasal size.
Camera distance can affect the apparent nose and middle of the face, shifting facial ratios. Ward and colleagues modeled nasal appearance specifically; their model doesn’t validate other facial ratios. While I was interested in testing other facial ratios, we were unable to find any research on the topic. As such, this post isn’t about measuring every possible facial ratio. Rather, it’s a guide to measuring those that researchers have tested in some detail.
Measuring the Vertical Thirds
First, measure from the middle of the face down to the lower portion. The website will calculate the ratio for you. How does it do it? By finding the vertical endpoints on your face. There are multiple ways to interpret vertical thirds and upper-thirds, however. Here’s one.
On this website, we consider the “upper third” to be the space from the hairline to the eyebrows. The middle third is the distance between the eyebrows and the base of the nose, while the lower third is the distance between the base of the nose and the tip of the chin. We compare the middle-third height with the lower-third height. We divide the first by the second.
This calculator excludes the upper third from the measurement. If you want a conventional vertical thirds ratio, the comparison between the upper and lower thirds is made with the assumption that both are measured at the same point along the face. That is, the upper third is from the hairline to the eyebrows, and the lower is from the base of the nose to the chin. If you choose the middle-third height divided by the lower-third height, the calculation becomes more straightforward. That ratio is known as the face’s middle-to-lower ratio, typically just referred to as the vertical third ratio.
Unfortunately, there’s no clear definition of where the hairline begins. Hair grows in many places, so it’s difficult to say whether it’s actually hidden, or simply omitted. When hair is hiding behind the ears, or when it’s styled back, that might indicate a hidden hairline. Otherwise, it’s simply being omitted rather than estimated. We’ll omit the upper third here, too.
If you look at the figure below, you can see how we define the middle third (from brows to nose base), and the lower third (nose base to chin). The middle-to-lower ratio compares the middle-third height to the lower-third height.
It should come as no surprise that our website says that the lower third is slightly longer than the middle third. The typical ratio ends up being a little under 1. If you’re looking for something more detailed, however, we’ve recorded the exact endpoints of each section of the face, and how they compare to other definitions of the vertical thirds.
One way to think about the vertical thirds is as a mathematical formula: you divide the middle third by the lower third to get the ratio. A different measurement divides the entire length of the face (upper + middle + lower thirds) by the width of the face. This gives a whole-face length-to-width ratio. If you want to do this, however, it’s worth noting that our site defines each division in terms of certain fixed landmarks, such as the hairline, brow line, nose base and chin.
For anthropometric research, the upper third of the face runs from the hairline (trichion) to the mid-point of the nose (nasion). This defines the “trichion-nasion” segment, which measures approximately 40% of the face’s total length. The middle third spans from the mid-point of the nose (nasion) to the subnasale point (n-sn), or the area between the bottom of the nose and the upper lip. The lower third runs from the subnasale point (sn-gn) to the gnathion, which marks the point of the chin. Together, they define the total length of the face from trichion to gnathion (tr-gn).
These are all the recorded endpoints of each of the upper-, middle- and lower-third segments.
Middle-to-lower comparison
Upper third (tr-n)
Trichion to nasion
Lower third (sn-gn)
Subnasale to gnathion
Middle third (n-sn)
Nasion to subnasale
Note: We’ve created an online calculator that lets you plug in values manually, but it’s best to keep your webcam or smartphone camera at arm’s length or a little farther away. We’ve documented a few examples of how we would measure the face using a pixel scale, but it’s worth keeping in mind that these are all hypothetical.
You could convert the distances above into ratios by dividing the middle third by the lower third, or vice versa. Let’s say you took a photograph of your face, and that the distance from your brows to the base of your nose was 340 pixels long. The distance from the base of your nose to the bottom of your chin was 200 pixels. Then your vertical thirds ratio would be 340 ÷ 200 = 1.70.
Inner-Eye Gap and Eye Fissure Length
Let’s suppose that your eyes were wider apart than your pupils, as measured from their respective corners. The distance between your pupils is called the interpupillary distance. The intercanthal distance (ICD) is the gap between the inner corners of your eyes. In anthropology, you can find out what you call the dimensions of each of the eye fissures.
In terms of proportions, however, there’s another way to think about the eyes. Some studies assume that the gap between the inner corners of the eyes is equal to each eye’s full inner-to-outer-corner width. If you have wide-set eyes, that means the gap between your inner corners will be larger than the outer. If you have narrow-set eyes, the opposite is true. The ratio between the inner-eye gap and each individual eye’s corner-to-corner width can be used to establish a rudimentary facial proportion.
The intercanthal distance, also known as the inner-eye gap, is defined by endocanthion to endocanthion. An alternative measure is called the eye fissure length, and refers to exocanthion to endocanthion. You can find these on the human face, and compare the inner and outer widths of the eye separately.
An early study looked at these measurements in conjunction with facial symmetry, and found that people rated faces as more attractive if their eyes appeared symmetrical. One limitation of this technique, however, is that it doesn’t establish a full set of five equally spaced facial divisions. Instead, it focuses on the relationship between just the eyes.
Another study looked at the relationship between the inner-eye gap and the eye fissure length. The researchers found that the gap was wider than the eye in every participant.
Limits of Facial Canons
A quick review of these various conventions helps to understand why numerical proximity doesn’t equate to attractiveness. Many of these “tested” canons are limited in applicability, and the results vary widely among individuals. For instance, in one study, researchers compared four neoclassical canons and discovered that none had strong overall applicability within their selected sample of young adults without facial dysmorphology.
In fact, they didn’t meet the standard. One of the studied models required the upper, middle and lower sections of the face to be roughly the same length. The participants in this particular study didn’t meet that requirement. The other model, the orbital canon, assumed that the inner-eye gap was the same as the width of the eye. Again, no participant met that criteria.
The researchers also compared their findings with previous studies. They found significant differences between men and women in how often variants of the facial three-section and orbitonasal canons occurred.
The Golden Ratio and Attractiveness
I won’t pretend that this is the definitive way to assess attractiveness. The most common approach is to use the golden ratio (approximately 1.618), and many studies have found that this seems to correlate with attractiveness.
That said, it’s worth understanding why numbers don’t necessarily mean anything. If I told you that my attractiveness score was 1.7, and yours was 1.5, that wouldn’t really tell us much about either of us. Neither would it mean that my face is objectively more attractive than yours. If the golden ratio is considered a target, then perhaps the closer we are to that number, the better our chances. But it’s still unclear what exactly contributes to attractiveness, and how we should measure it. Being closer to 1.618 tells you how close you are to that target. It doesn’t give you an attractiveness grade or a population percentile, a distinction we make in our golden-ratio article. Our geometry score also agrees only partly with the attractiveness ratings used to calibrate it.
Reference Ranges and Interpreting Your Results
Our goal in this series is to provide a partial picture. We’ve taken photographs of many different individuals and converted them into 2-Dimensional measurements. Our reference ranges and scoring scale are based on 101 adult faces rated for attractiveness by 2,513 people (Face Research Lab London Set, DeBruine & Jones 2017). Our reference ranges aren’t universally applicable, nor do they necessarily reflect normality. We know that the attractiveness scale varies by culture, and that there are exceptions to every rule. If your result changes between photos or falls outside our reference range, compare the lighting, distance, head angle and expression across your two or three photos before interpreting the numbers. Check where the calculator placed the endpoints, too. For FWHR, those points can shift with hair, a beard, head turn or brow position. Different calculators can also place them differently.
Ultimately, we’re offering a partial description of what the face looks like, based on the information that we’ve collected.
Sources
Measure your own face
Free, in your browser. Your photo is never uploaded.
- Attractiveness TestFace rating, PSL range and eye type.
- Face Symmetry TestHow evenly the two sides match.
- Jawline AnalyzerJaw angle, jaw width and chin taper.